Drupal 9 Debugging Techniques: All You Need to Know

Are you currently building or working on a site in Drupal? As a result, do you seem to be facing different types of issues in the bargain? Drupal web development service, Drupal 9 debugging techniques are here to help you out.
Picture this.
You are working on a new project and need to fix an issue but…
- A specific feature or your site isn’t working.
- You want to get acquainted with how a particular feature functions so you can understand its functionality better.
- You don’t know how to go about rectifying the problem.
Well, You aren’t alone! It’s all part and parcel of the process of working on a task.
These are the times when debugging comes into play — To trace the flow and understand the code step by step so you gain additional information about the context and state of your application. Inevitably, it helps you understand where you are going wrong.
While tracing, you may need to know the different values in variables inside the template or module file. Here are 5 Drupal 9 debugging techniques that will help you recognize common symptoms and how to address them.
- Disable your cache in Drupal Settings.
- Enable Twig Debugging
- Use PHP functions to print variables
- Devel Module
- Web Profiler
Disable your cache in Drupal Settings
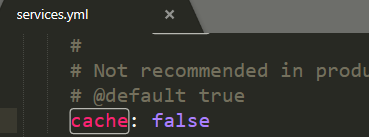
Also, since drupal web development service, Drupal 9 caches most of the things like blocks and rendered twig templates, but while coding it becomes difficult if things load from the cache as your latest changes won’t be visible unless you clear the cache. Therefore, while developing if you need to see changes quickly without clearing you need to disable the cache.
Also, since Drupal 9 caches blocks and rendered twig templates, they are stored in the filesystem so that they can load faster, but while coding you want the files to render each time therefore you must set the cache to false in the sites/default/services.yml
jxn7qq7.png (369×137) (imgur.com)
Enable Twig Debugging
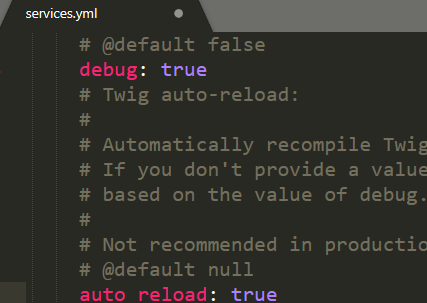
To enable twig debugging, go to sites/default/services.yml and change the value of debug to true and auto-reload to true.
nj4K8vI.png (427×303) (imgur.com)
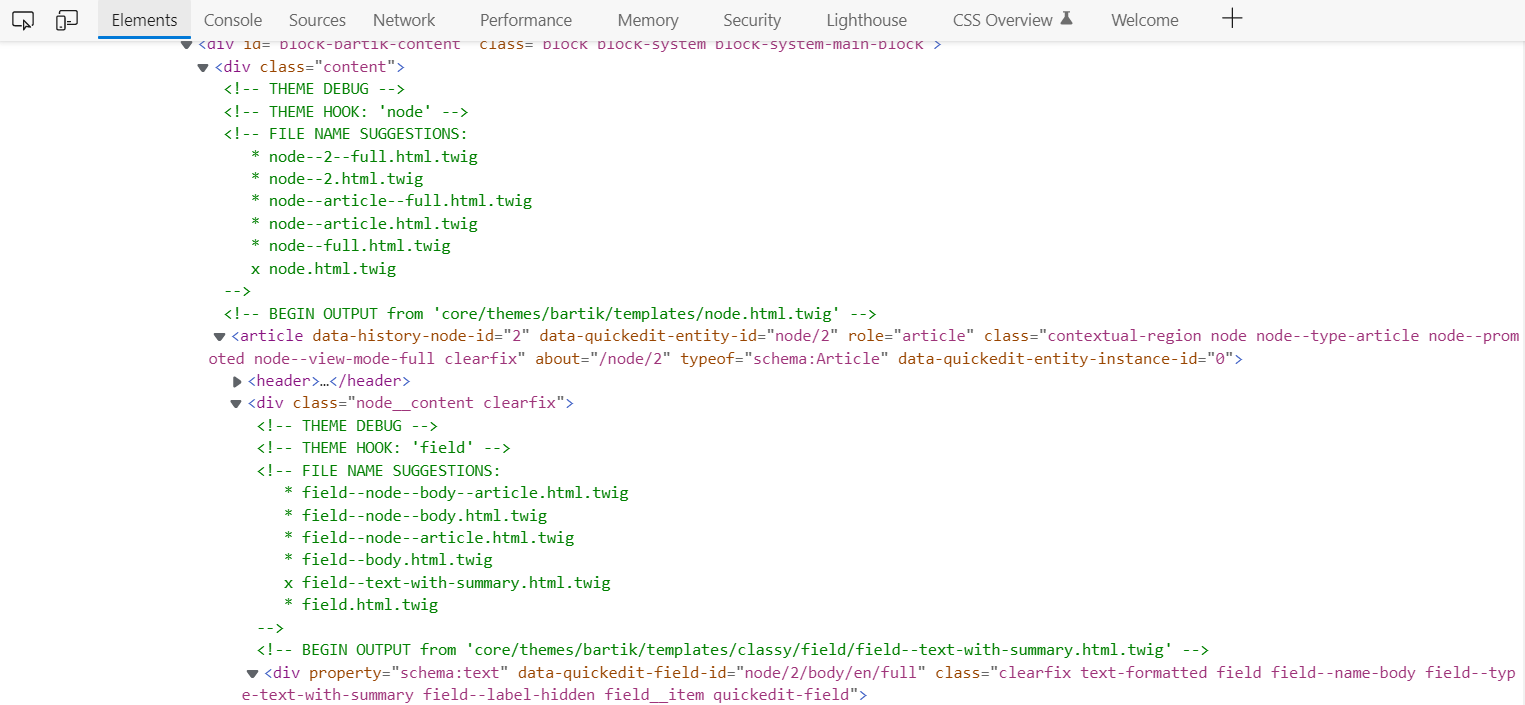
Enabling twig debugging helps to show the template path, and the hook suggestions as well as template suggestions.
eT3Lxcd.png (1525×705) (imgur.com)
Once you set debug to true, you can use {{ dump() }} inside the twig template to print the variables.
HLlPIVv.png (928×807) (imgur.com)
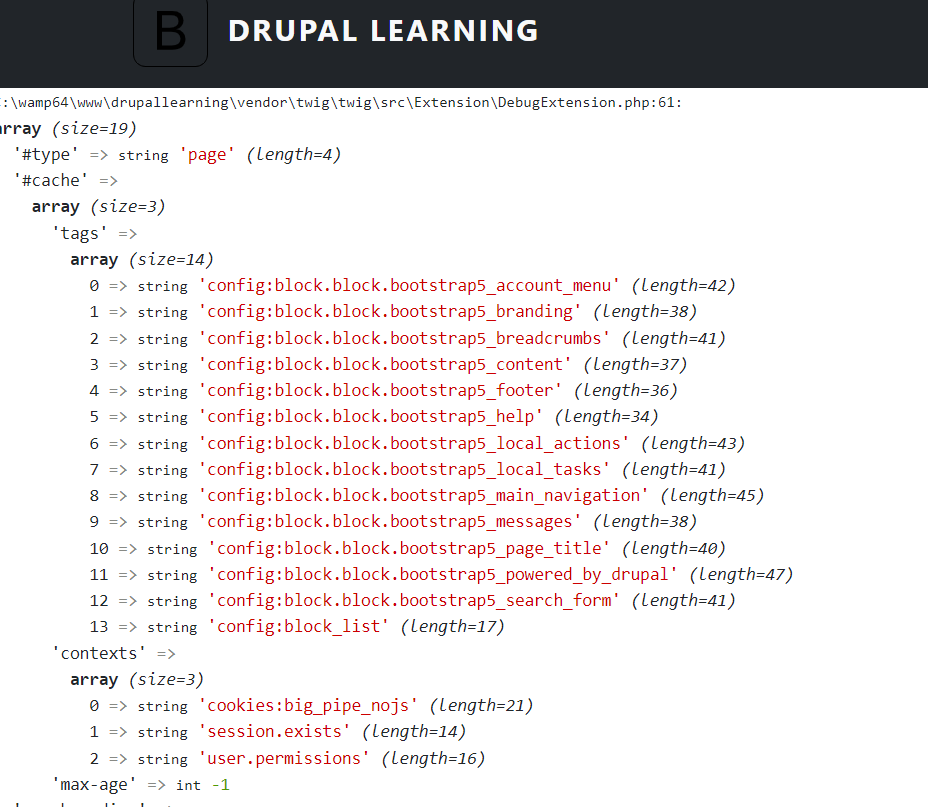
PHP Functions to print variables
- var_dump()
T9zksST.png (763×490) (imgur.com)
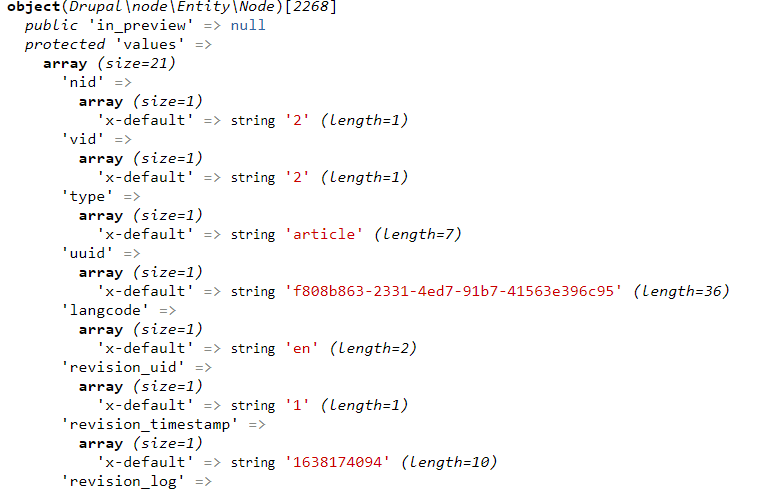
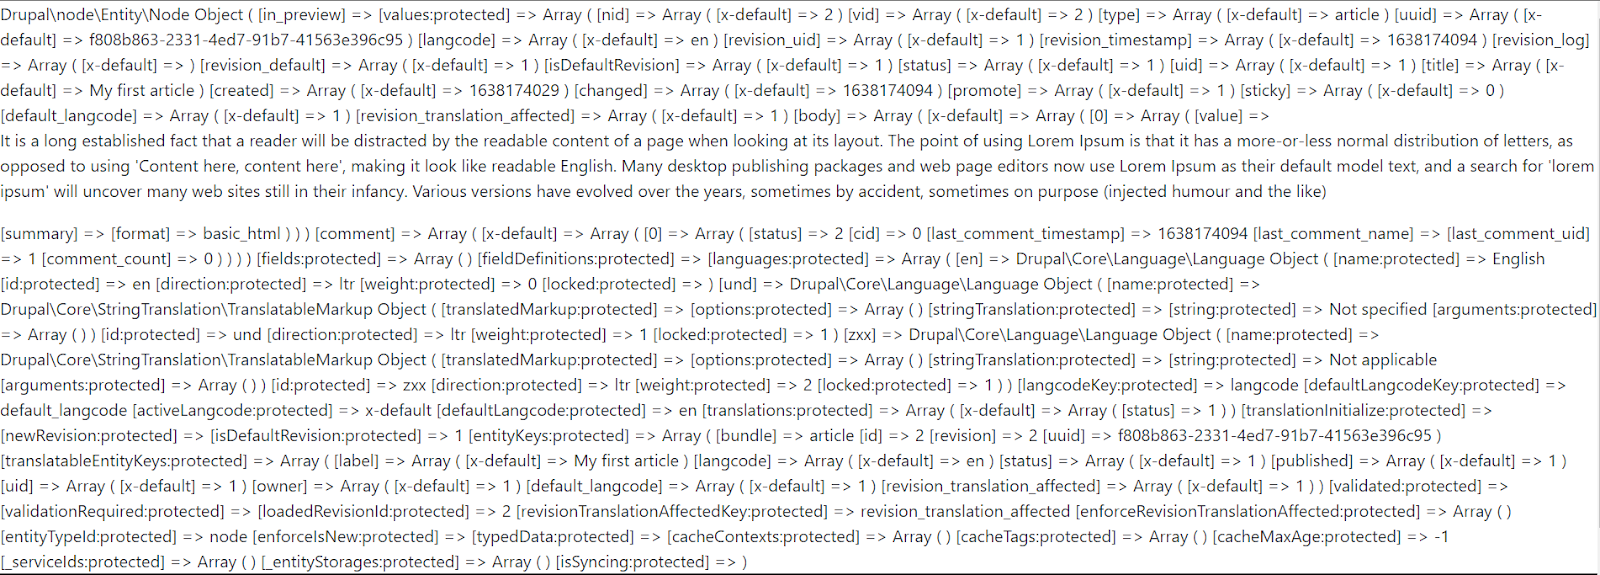
- print_r()
E9dG42K.png (1902×683) (imgur.com)
Devel Module’s Kint
In Drupal 9, installation of devel module 8.x-2.1 is not possible. It is replaced by 4.0.0 without the submodule Kint. However, there is an additional module Devel Kint Extra having the original functionality.
Pre-requirement : Devel Module
You must install the Devel Kint Extra using composer :
composer require kint-php/kint
N12WxTq.png (1882×856) (imgur.com)
Kint:
kint($node);
This code will give the properties of the node from which you can click on + sign to expand the arrays on the same page.
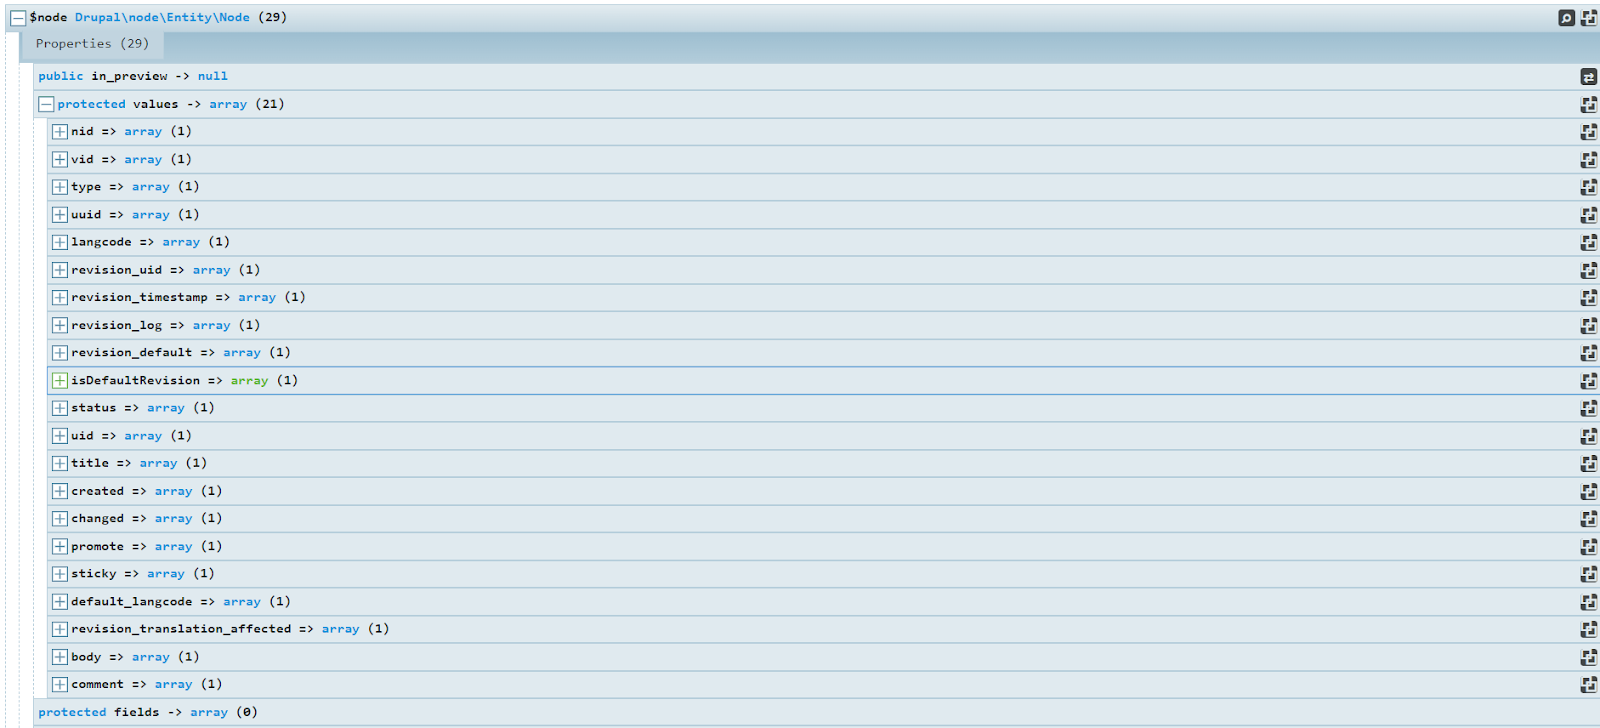
Clicking on right sided icon to open the specific array in a new tab of the browser and allows to keep notes

Due to Kint’s configurations there appears an error out of memory. To prevent this in the settings.php, you must override it using the following code.
// Change kint max_depth setting.
if (class_exists('Kint')) {
// Set the max_depth to prevent out-of-memory.
\Kint::$max_depth = 4;
}
You can also print variables in Twig templates using {{ kint() }}.
LC3etXd.png (1894×674) (imgur.com)
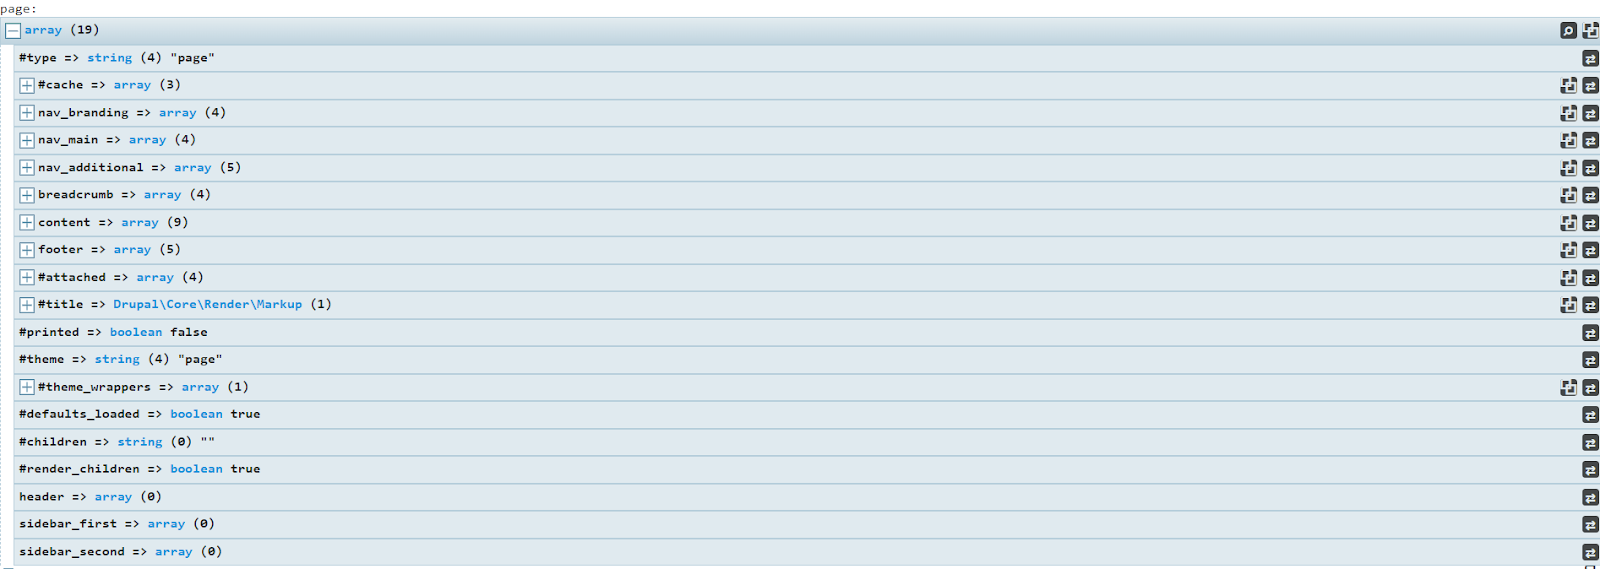
ksm:
ksm($node)
rhhYdWJ.png (1609×770) (imgur.com)
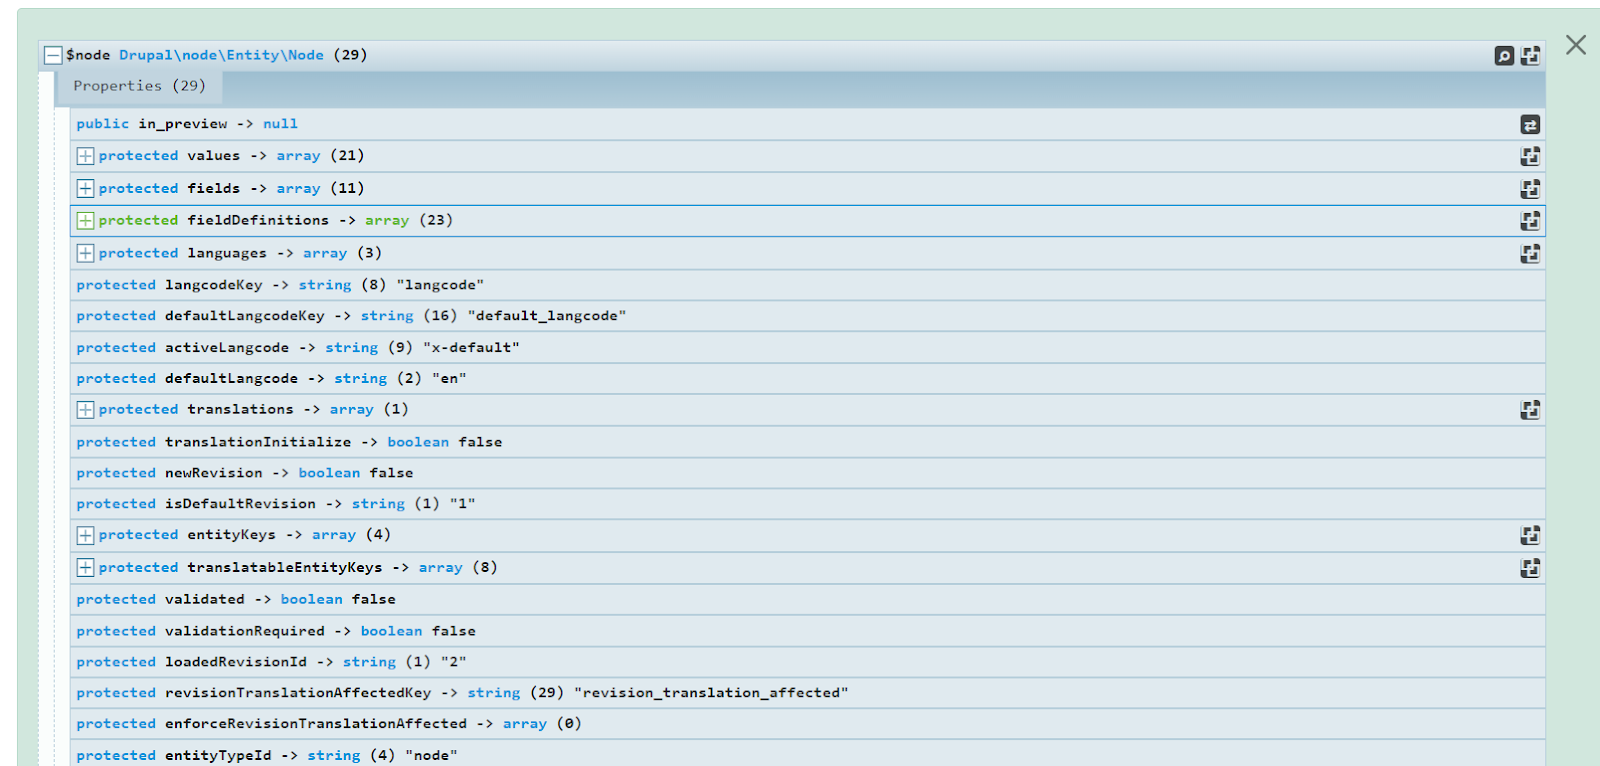
dpm :
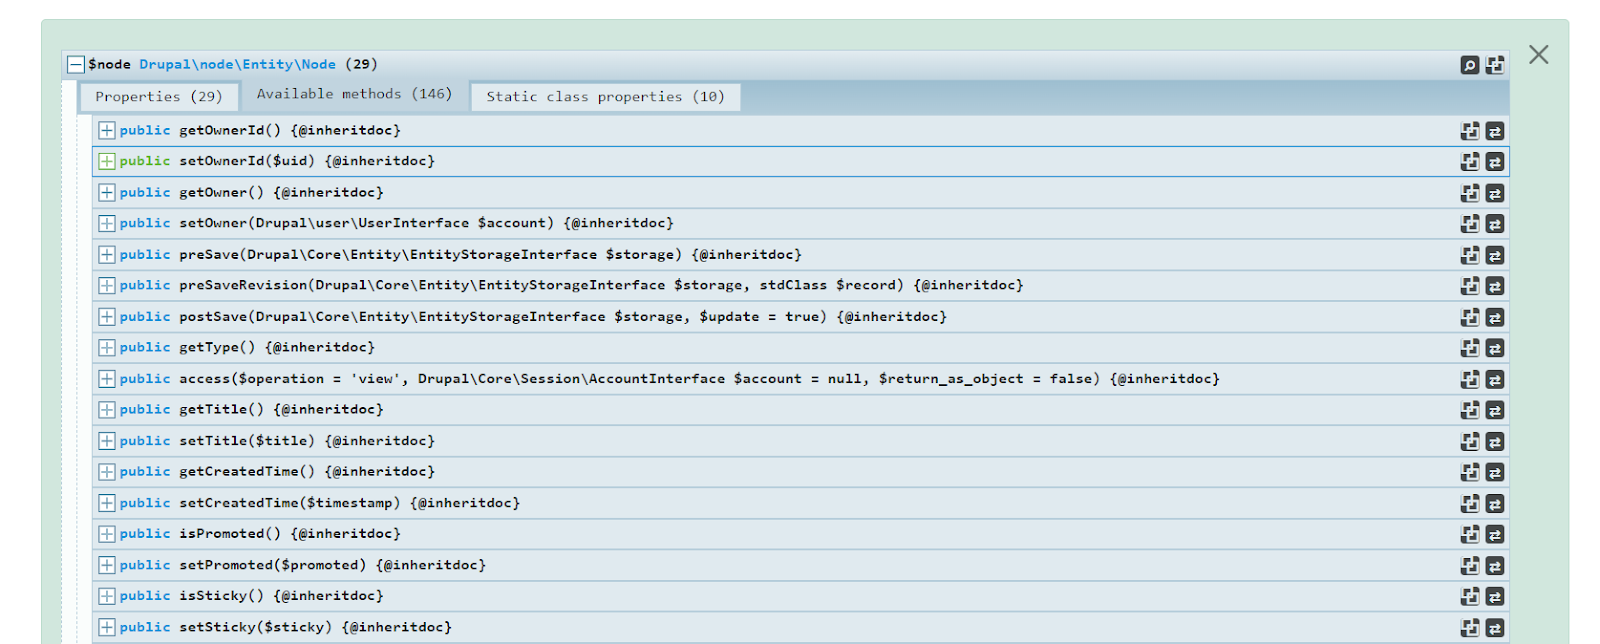
Inside Devel settings, at this path /admin/config/development/devel if you select Kint extended, you also get Available methods and Static class properties which is also very helpful while debugging.
dVaAkD9.png (1730×316) (imgur.com)

Ck7YrUK.png (1675×674) (imgur.com)
You can also print variables in Twig templates using {{ dpm() }}.
Web Profiler
When dealing with performance related issues, Web Profiler is very useful.
u2e8Jk5.png (798×168) (imgur.com)

5JJHc3D.png (1899×46) (imgur.com)

This is the Web Profiler Bar coming at the bottom of the page.
It provides you with different information such as Drupal version, php configurations, Request, Performance Timing, Views, Blocks, Forms, Routes, Cache, Assets etc which can be helpful to increase the performance of the site or page.
You can also set what you want to see on the web profiler by going to this path : /admin/config/development/devel/webprofiler
4NIRDUG.png (651×841) (imgur.com)
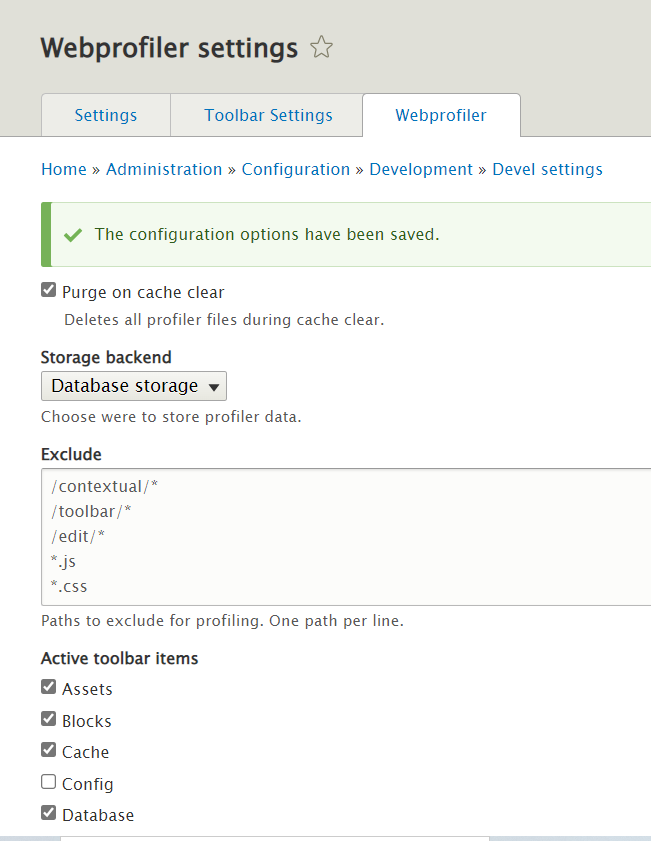
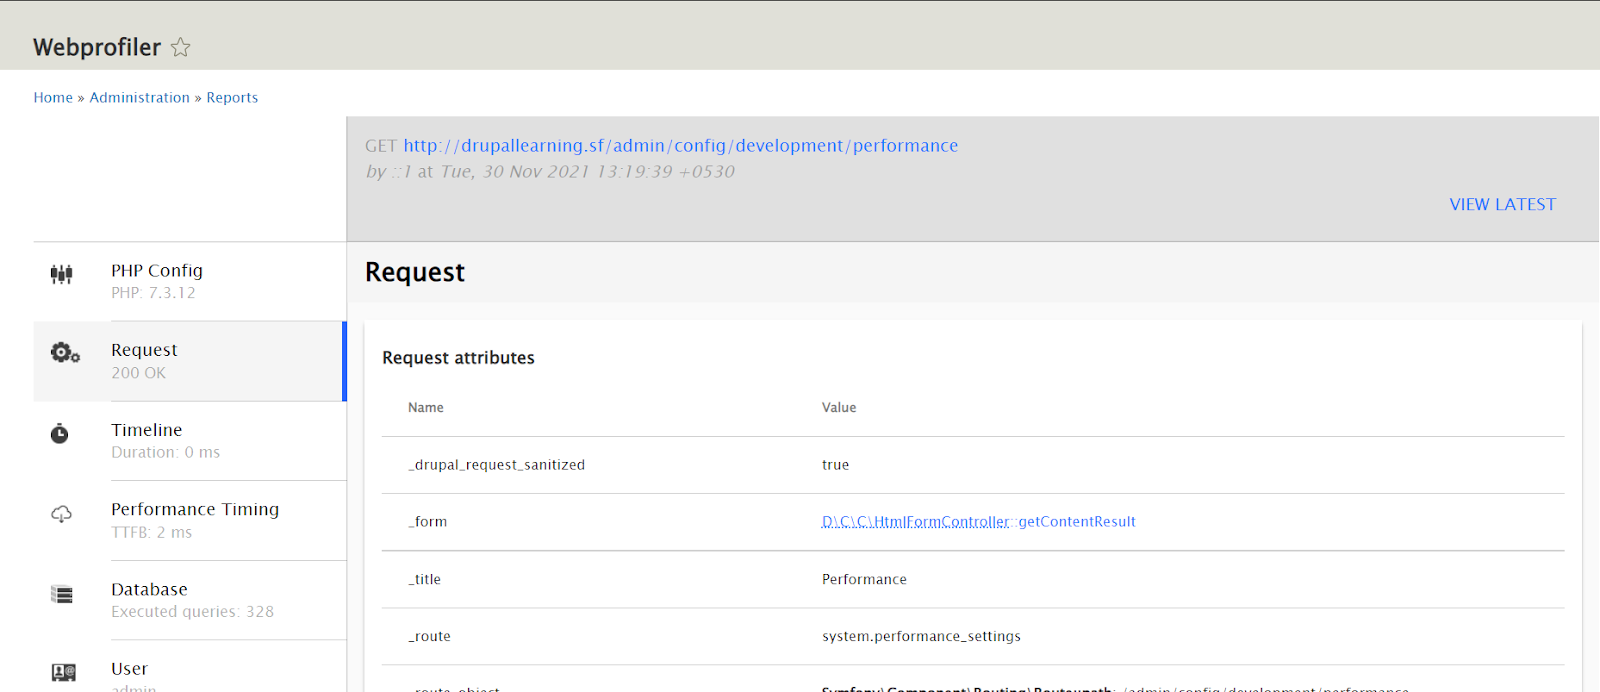
If you click on any item on the web profiler, you will be directed to a new page with a summary of all the information for that item.
zqXC50w.png (1857×803) (imgur.com)
All in all, debugging is a discipline that needs patience along with microscopic attention to detail. In a bid to meet deadlines, resolving bugs and adding innovative features, slowing down and moving forward meticulously with calculated steps is a skill that you need to learn by drupal web development service.
After all, when it comes to solving tedious tasks, taking measured steps is what is needed to get to the root cause of an issue and solve it successfully!

Software Development Agency Tips: Boost Revenue with New Platforms

Xcode 9 Custom Templates
